Jessica L. Larson and Gabriel Becker
We can use knitr and ReportingTools together, as shown in this very simple example from our basic vignette.
Here we will create a simple report that integrates ReportingTools report capabilities with knitr.
To build this report, simply call the knit2html function from the
knitr package.
knit2html from within the
reportDirectory. Alternatively, we can call knit2html with an
output argument that matches the reportDirectory
argument passed to HTMLReport.
Note: the output html file must be in the directory indicated by
the location argument. If this is not the case the ReportingTools
functionality will break. By default, knitr will write the
destination file within the current working directory, and
ReportingTools will assume that. When calling knit2html with an
alternate output argument, it should match the reportDirectory
argument passed to HTMLReport. The one exception to this rule is
package vignettes, where it is necessary to place the vignettes in
the vignettes directory and pass “../inst/doc” as the
reportDirectory. If the output lands in the vignettes
directory, R would clean it up after building the vignette, and all
images, javascript, etc would be lost.
my.df <- data.frame(EGID = c("103", "104", "105", "106", "107"),
                    RPKM = c(4, 5, 3, 100, 75),
                    DE = c("Yes", "Yes", "No", "No", "No"))

library(ReportingTools)
We now can publish our data frame as table through the use of the knitrHandlers. When using knitrHandlers we must specify the destination location as an argument either to the knitrHandlers constructor function directly or as an additional argument to HTMLReport when knitrHandlers is specified in the handlers argument.
We do not call finish since we will still add output to our knitr report.
library(XML)
instDoc <- file.path("..", "inst", "doc")
htmlRep <- HTMLReport(shortName = "knitrReport", handlers=knitrHandlers,
                      reportDirectory = instDoc)
#publish(my.df, htmlRep)
htmlRep[["mydf"]]<-my.df  ##this line is equivalent to the line above
| EGID | RPKM | DE |
|---|---|---|
| EGID | RPKM | DE |
| 103 | 4 | Yes |
| 104 | 5 | Yes |
| 105 | 3 | No |
| 106 | 100 | No |
| 107 | 75 | No |
Thus we are able to include tables generated by ReportingTools based directly within knitr documents.
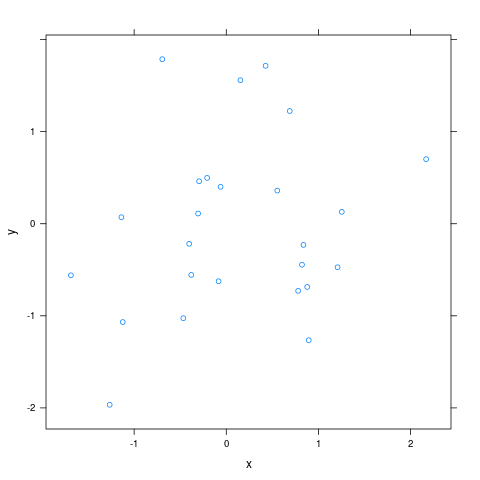
Now we will try to put in an image:
library(lattice)
set.seed(123)
htmlRep[["pic"]] = xyplot(y~x, data = data.frame(y=rnorm(25), x=rnorm(25)))
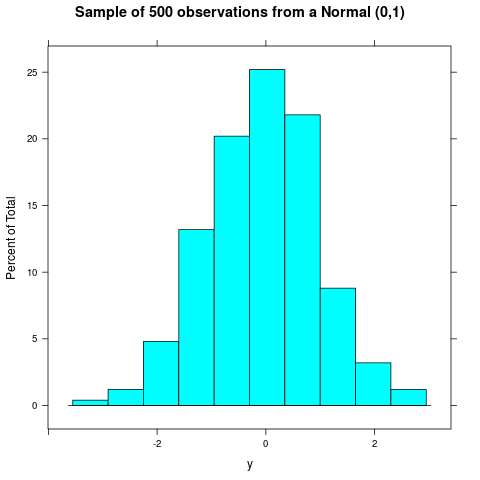
##We could also add a picture like this:
y <- rnorm(500)
pic2<-histogram(y, main="Sample of 500 observations from a Normal (0,1)")
publish(pic2, htmlRep)
To build the report, simply call the knit2html function from the
knitr package.
As we have seen, using ReportingTools in conjunction with knitr is as easy as selecting a different set of ReportHandlers (in this case those generated by the knitrHandlers constructor function) and ensuring that the location of the final HTML file matches (up to the directory) that specified by the location field of that ReportHandlers object.
This allows us to create rich knitr-based reports and vignettes while leveraging the power of ReportingTools to format and display generated R objects.